Temperature
More warming is projected over the Western side of the country, whereby a warming of up to 3.4ºC is projected by 2100. A warming of less than 1.760C for 2050 and 3.280C for 2100 is projected over parts of the northern coast regions and north-eastern highlands. A warming in excess of 1.770C for 2050 and 3.30C for 2100 is projected over the Lake Victoria zone. A warming in excess of 1.390C for 2050 is projected in central Tanzania zone. And a warming of 3.180C for 2100 is projected for the southern coast including Mtwara and Lindi regions (UNIQUE, 2020).
• Zanzibar
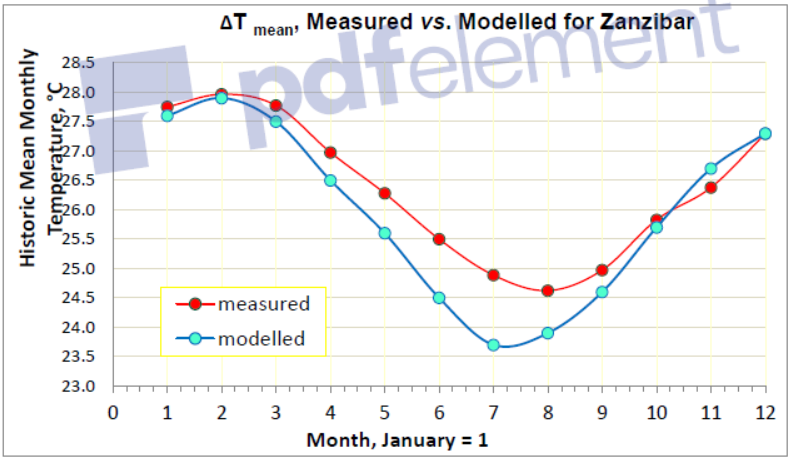
There is inevitably a small discrepancy between historic temperatures as computed, as opposed to ‘as measured’. The computed temperatures are the median of the model ensemble outputs, as averaged over the entire grid cell. The measured temperatures are for the specific location, in this case Zanzibar airport. These monthly discrepancies are shown in Figure 1, below. For the purposes of climate change this mean discrepancy, the ‘bias correction’, is taken as 0.4°C. That is, for climatic projections, Tfinal = Tmodelled +0.4.
Figure 1: The Bias Correction for mean monthly temperatures at Zanzibar
Zanzibar’s mean annual temperature was historically 26.4°C. The median projected temperatures (bias corrected) range from about 27.0°C in the 2020-39 time slice, to 29.4°C by the end of the century, with substantial variation according to the carbon emissions scenario. The change estimates are shown in Figure 2. If somewhere between RCP 4.5 and 6.0 is regarded as the most likely, then the end of century temperature increase relative to the present will only be about 1.6°C, yielding a mean annual temperature of 28°C by century end.
Figure 2: Ensemble Model Projections of Changing Temperature in Zanzibar
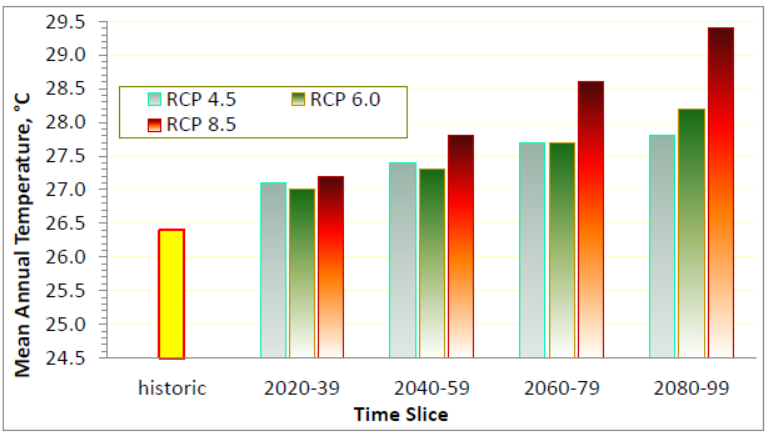
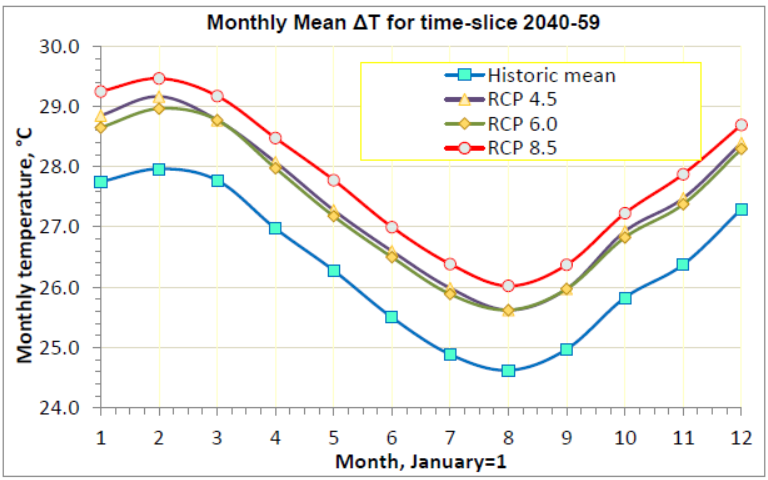
Figure 3: Projected Seasonal Changes in Temperature for Zanzibar
• Simanjiro District
The closest meteorological station to Simanjiro district, and hence the primary dataset is for Arusha airport, at 3°22’03.1” south, 36°37’33” east, at an altitude of 1388 meters, and is considered to be of high quality, with a station record of about 59 years. Arusha is some 130 Km NW of Simanjiro.
Babati station, at an elevation of 1416 meters, is 159 km west of Simanjiro (elevation 1287 meters), but only has rainfall data and a dataset duration of 26 years. However, the physiographic setting of Babati may be closer to that of Simanjiro. Simanjiro is 230 km from the coast, and hence has little or no climatic influence from the Indian Ocean.
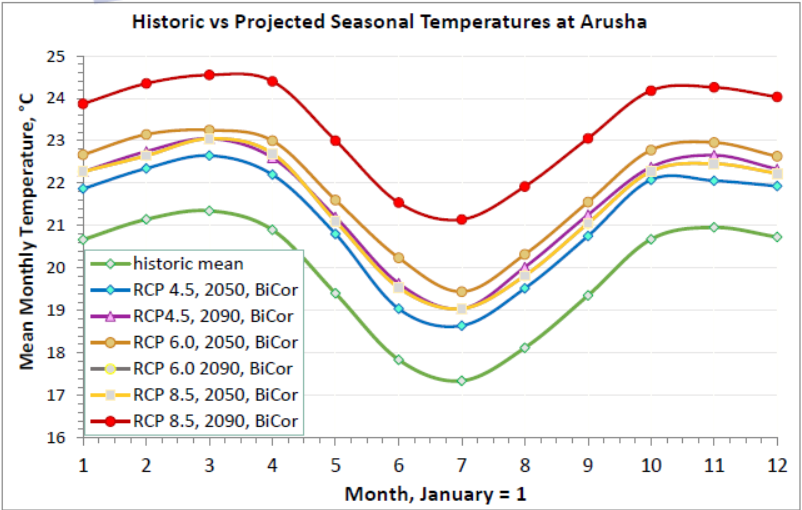
Projected temperatures are modelled on a mean monthly basis, shown in Figure 4, for 2050 and 2090, and for RCPs 4.5, 6.0 and the worst case 8.5. The most likely increase of about 1.5°C, relative to recent historic temperatures, is about normal for a tropical to sub-tropical environment.
Figure 4: Seasonal Temperatures at Arusha: Historic vs. Projected
• Kishapu District
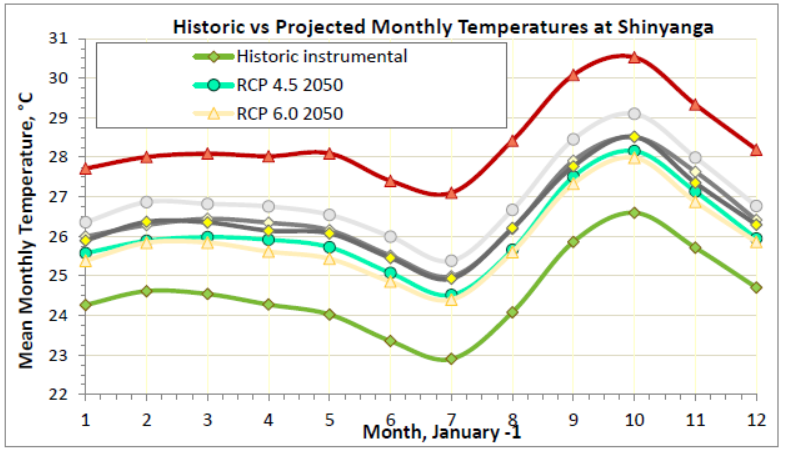
Kishapu, (1138m altitude), is 35 km east of Shinyanga meteorology station, the latter having 24 years of unbroken temperature data. This is too short a record to detect the onset of any significantly increasing temperature change. Both Shinyanga and Kishapu are about 150km south of Lake Victoria, and lie at the southernmost limit of climatic influence from the Lake.
Figure 5: Historic and Projected Seasonal Temperatures at Shinyanga
• Mpwapwa District
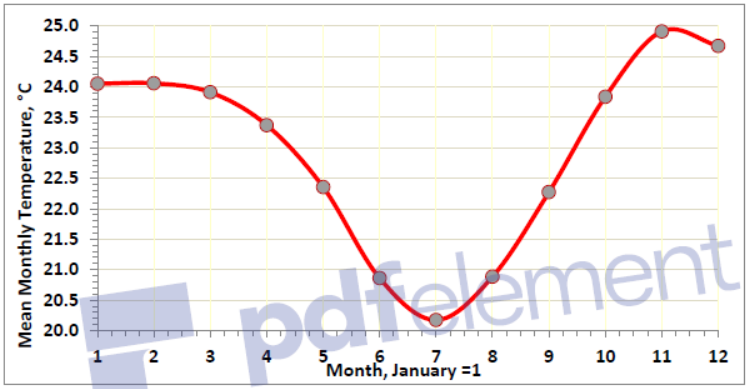
Mpwapwa has an excellent 84-year-old rainfall record, but somewhat more microclimatic variation than Dodoma. Remaining meteorological met are all from Dodoma, some 85 Km further west. Dodoma is about 50 meters higher than Mpwapwa.
Figure 6: Historic Mean Monthly Temperature Variation at Dodoma
• Mvomero District
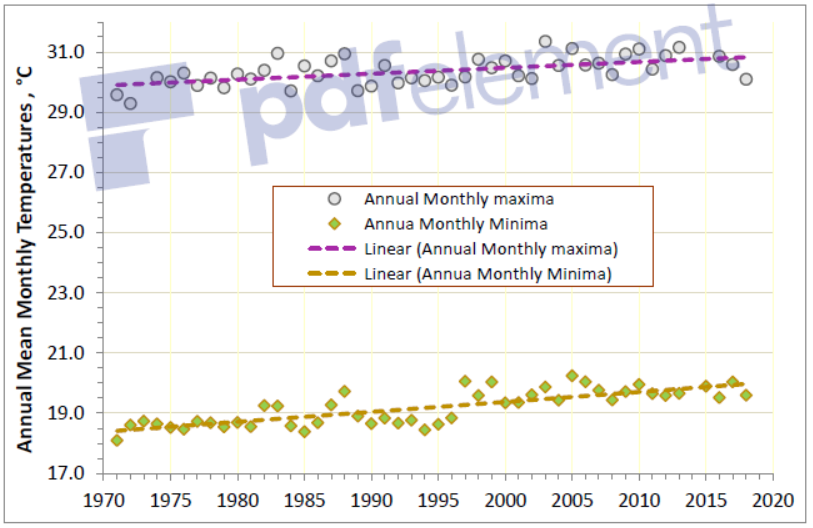
The highest historic temperature at Morogoro was 38.8°C. Most projections have maximum temperatures seldom exceeding 40°C by the end of century. Curiously, the normal trend of night-time minima warming much faster than day-time maxima, does not appear to apply in Morogoro, as is evident from Figure 7.
Figure 7: Trends in Annual Mean monthly Tmax and Tmin at Morogoro
