Rainfall
• General
The ‘precipitable moisture’ in the atmosphere is closely linked to temperature, but cloud formation, cloud-top temperatures, and storm advection are all poorly constrained by the model, and hence extreme event rainfalls cannot be estimated either at any given location, or at any particular time of year, with a high degree of confidence. On the other hand, generalized rainfall extremes can be estimated, and are presented in Figure 1. The most extreme precipitation is only about 5% greater than those of the historic record. However, higher frequency/lower intensity events could be up to about 30% more intense than in the historic record.
Note that the runoff is not directly proportional to the rainfall, so an increase of only 10% in extreme rainfall can, and almost certainly will, result in a much higher proportion of runoff, resulting in greatly enhanced quick flow (flash flooding). In addition, the erosive power of quick flow is approximately proportional to the fourth power of the runoff velocity, so a small increase in extreme rainfall will have a disproportionate impact upon hill-slope, soil and embankment erosion.
Figure 1: Generalized Extreme Rainfall Projections in Tanzania for 2040-2059
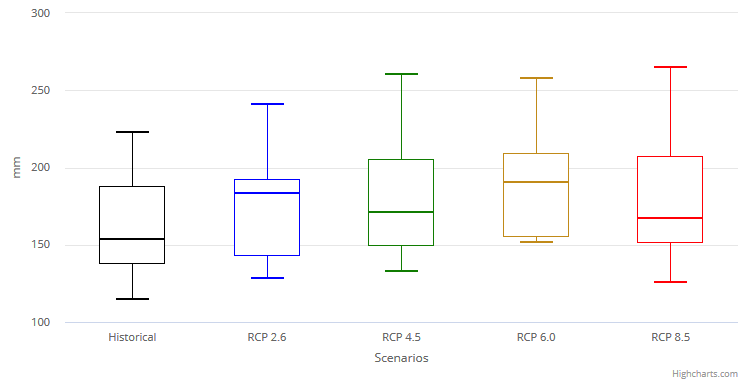
Source: World Bank Climate Change Portal
Notes: The Extreme Event Modelled is the 5-day rainfall at an average recurrence interval of 10 years. Symbols are maximum, upper quartile, median, lower quartile and minimum.
• Growing Season, Rainfall Seasonality and Crop Yields
In Tanzania, the potential growing season (>5°C) is essentially all year round, and hence there is no change to the duration of the temperature-governed growing season, even under the most pessimistic climate change projections. However, there are changes in both the intensity of photosynthesis and in the duration of excess heat stress.
The rainfall seasonality index measures the standard deviation of monthly rainfall against the mean rainfall. The larger the value, the more variable is the rainfall across the year. The smaller the value, the more evenly distributed is rainfall across the seasonal cycle. Under most RCP scenarios there is a slight decrease in rainfall seasonality in coastal and near-coastal districts, and either no-change or a slight increase in rainfall seasonality in more inland areas. Either way the modelled average effects are minimal. The change in standard deviation is dwarfed by the 10th to 90th percentile range of the model ensemble.
The CMIP-5 model changes in rainfall seasonal- ity are therefore statistically indeterminate. On the other hand, process studies and projections at regional level, particularly in respect of the ITCZ behavior, suggest some degree of rainfall intensification, concentrated over a shorter time-frame (Byrne et al. 2018a). That is, more rain is expected to fall throughout shorter rainy seasons, both in the ‘long rains’ and ‘short rains.
The World Bank has developed projections in the change in yield for various crops, an example of which is shown below, in Figure 2 (for maize). This serves to indicate the local variability to be expected in an average year. Farming viability, however, is determined not in average years, but by years of extreme conditions. Hence, such maps must be used with caution.
Figure 2: Crop Yield Projections for Low-Input Rain-fed Maize, 2080
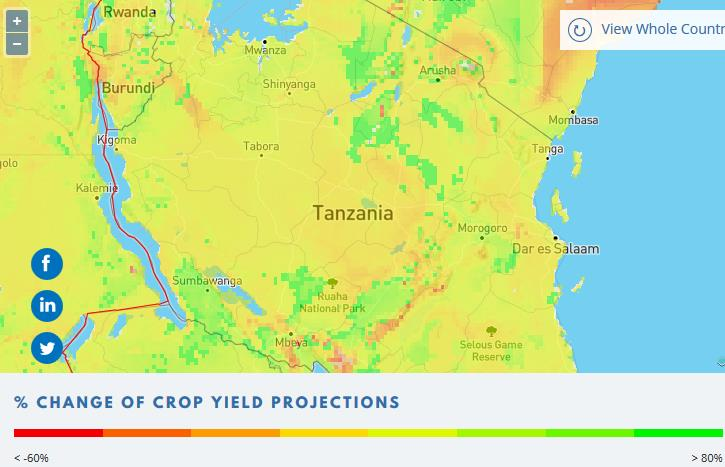
Source: WBCCP Agricultural Impacts
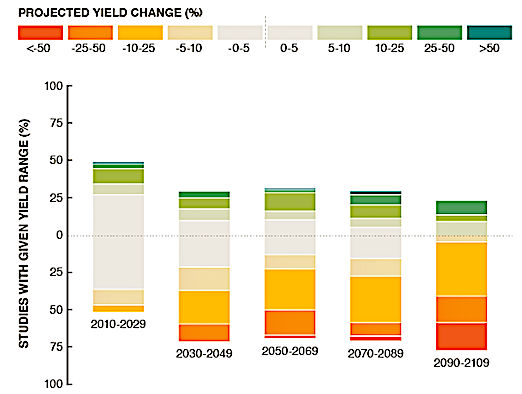
Some crops, such as some varieties of maize, beans and bananas, may actually benefit from climate-change impacts, at least in the short- to medium-term. However, the majority of modelling studies conclude that negative impacts will prevail from about the 2030s onwards. Beyond about 2050, a broad spectrum of crop yields will decrease by more than 10%. Higher CO2 concentrations and warmer temperatures will lead to greater biomass production, but probably at the expense of crop quality and nutrition (Figure 3 below).
Figure 3: Generalized Multi-Study Outlook for Crop Yields, by Time-slice